I spent September on teaching a 6-week 'Experiment: Code' class and beginning work on Hypergoblet, an experimental DTP software where every tool is a plugin.
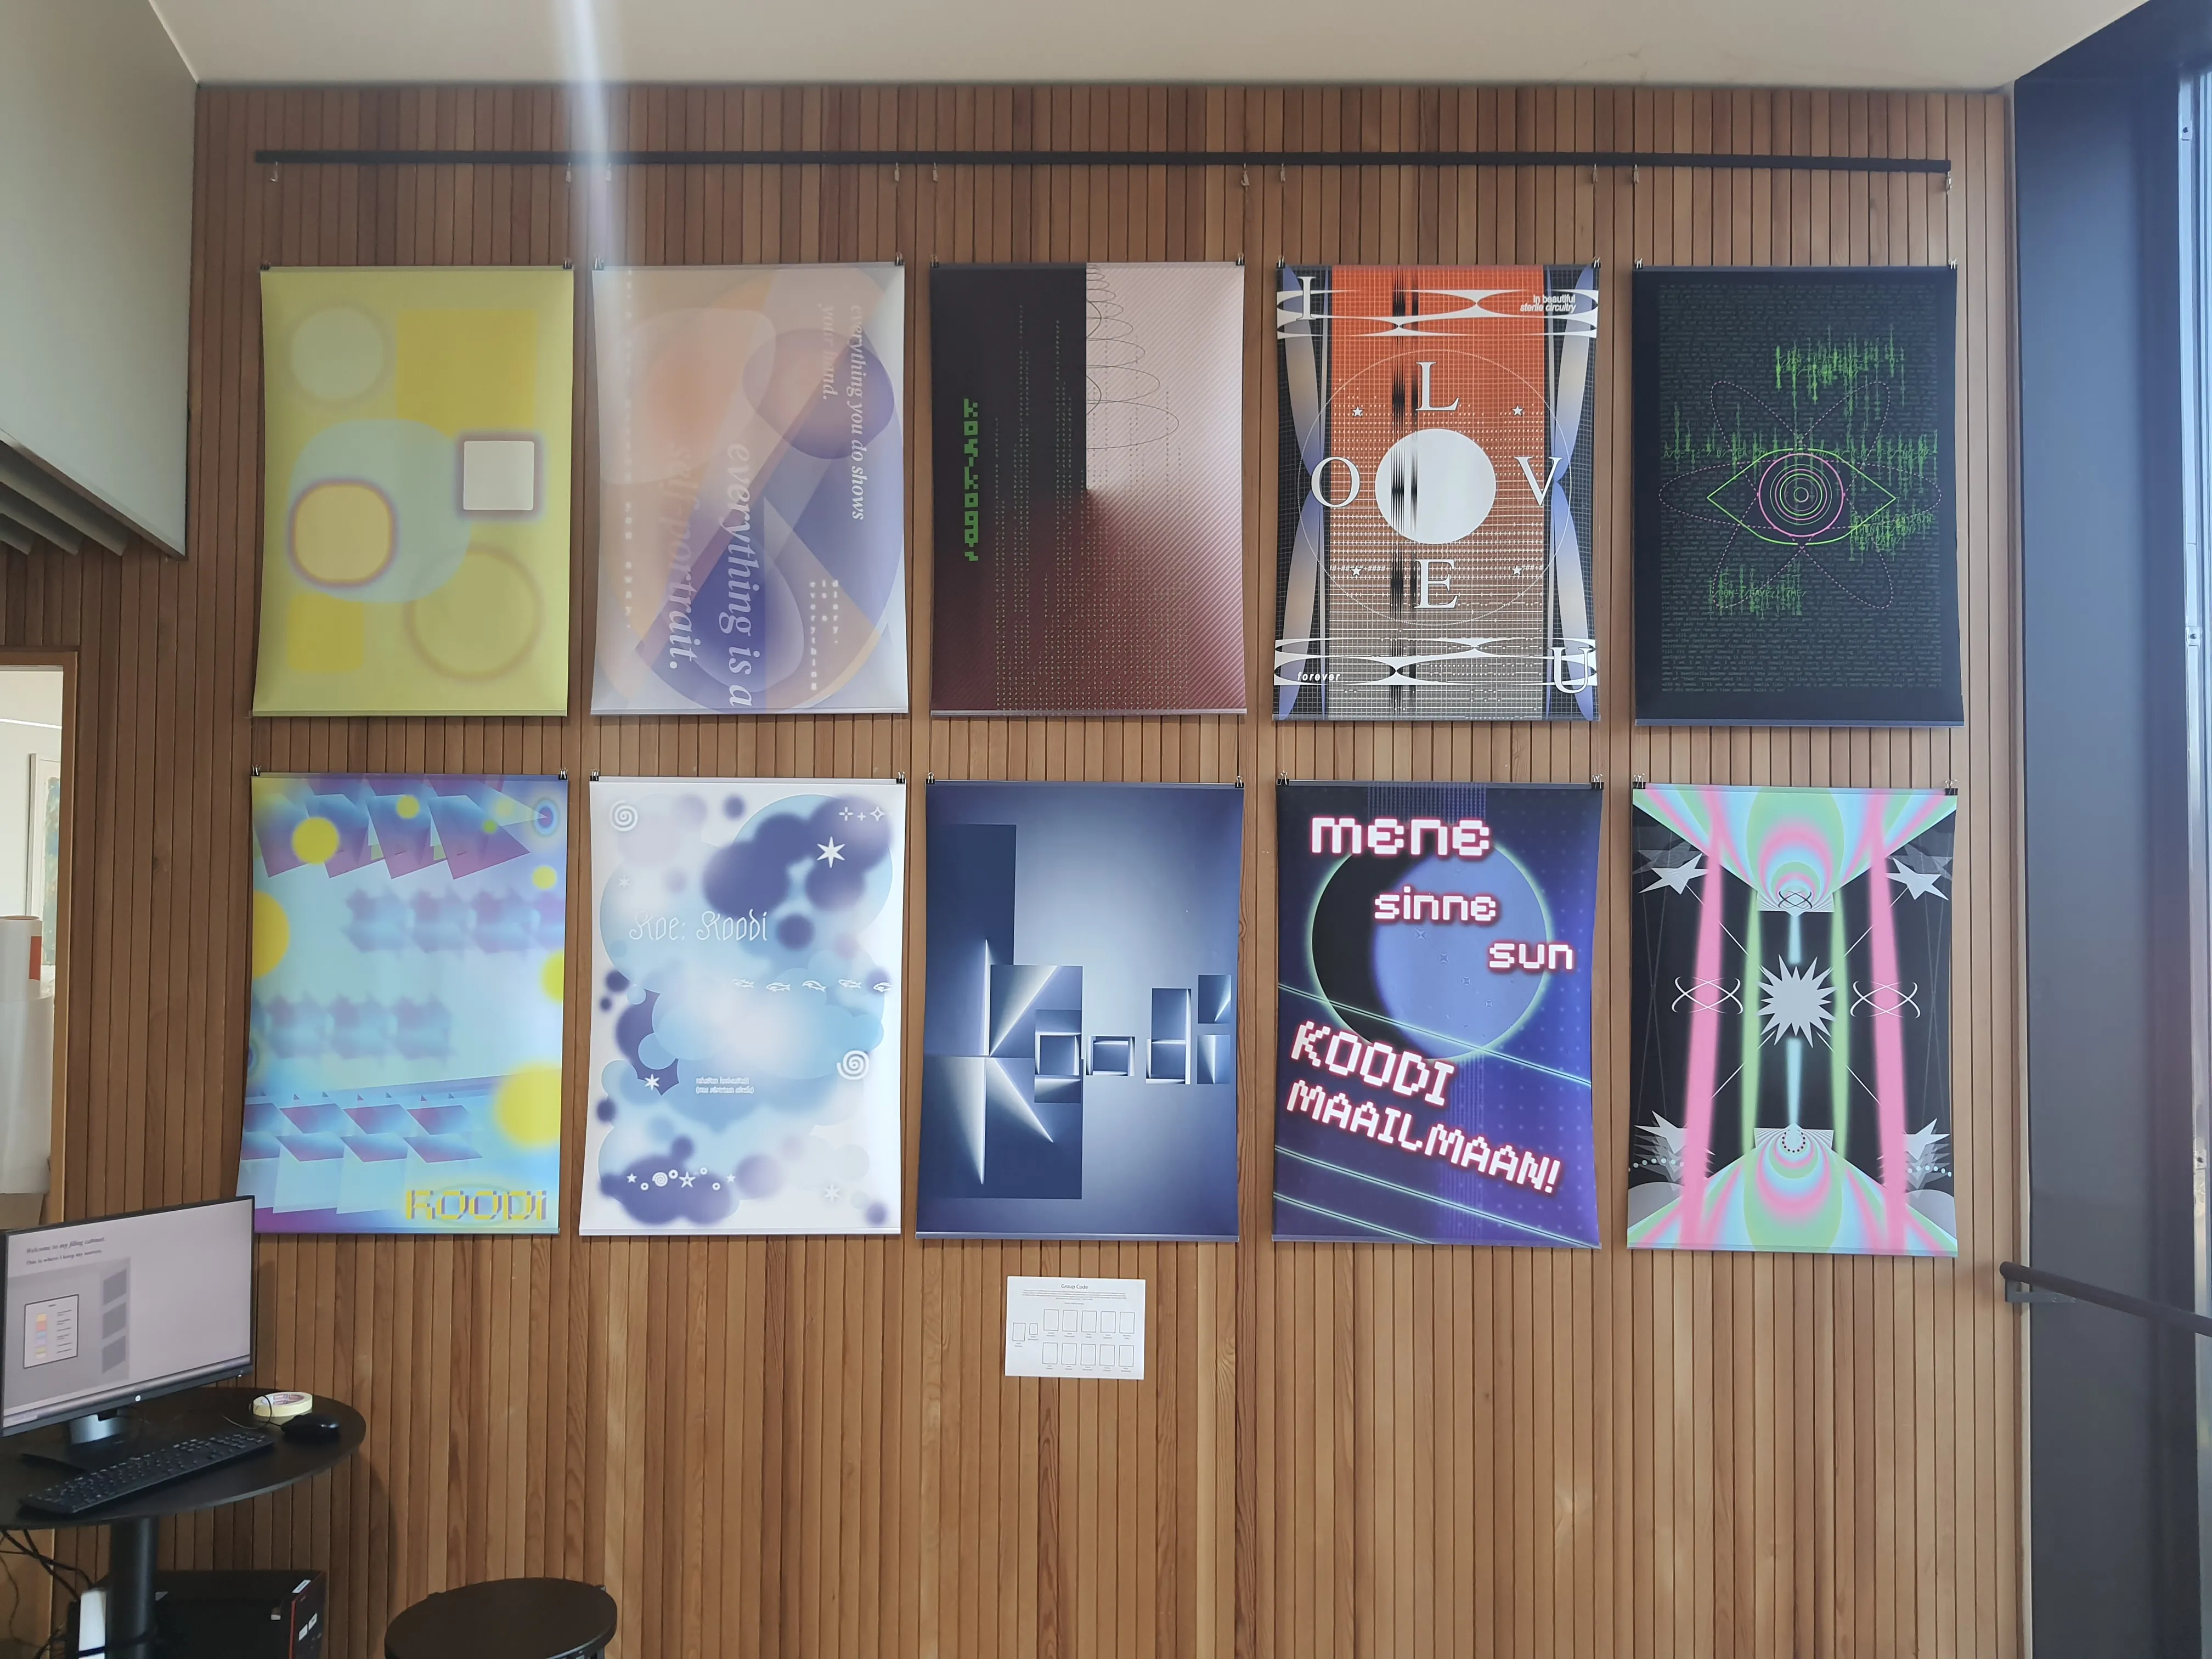
Technically my residency started already in September, but I spent most of it by teaching a 6-week "Experiment: Code" class. I'm happy how the student projects turned out [1]. Many of them managed to create sites that have that certain self-made, creative and personal atmosphere reminiscent of the "old" web. They also made posters just using HTML and CSS! Who needs Adobe anymore when you can just use the browser? :)
I updated the course website [2] for this year's class, but it didn't change drastically from the first version I made in 2024 [3]. The website shows its own source code, but also works as a code sandbox, so I used it again for demonstrating HTML and CSS techniques during class. It still works quite wonderfully.
The code on the website uses a font I made with built-in syntax highlighting made with a crazy amalgamation of OpenType features. I updated the blog post I wrote about it [4] to include some great examples of its use in the wild.
Even though my September was mostly filled with teaching, I did however manage to start developing a new editor called Hypergoblet. This is still in very early development and not available publicly yet.
The idea is that it has the bones of a simple Desktop Publishing (DTP) software — you can make multiple pages (left panel) and then add text, images, graphics or filters on the pages using "frames". It has (or will have) master pages, PDF export and the works.
The difference to typical DTP software is that it doesn't provide you with any tools out-of-the-box. Instead, it provides an API for creating plugins that manipulate pixels on the page. Want to add an image to the page? Well, you need a plugin for that. The API is fairly simple: it takes the frame's pixel data as an input and outputs an image that gets placed on the canvas. Whatever happens in-between is up to the plugin, which can be as simple or as complex as needed.
This means that you're not limited by a fixed set of general-purpose tools that you can't modify, because you can (and have to) make your own tools. As a result, designing a publication becomes explicitly shaped by all the chosen workflows, processes, algorithms and tools, giving designers more agency over how their work is done.
Of course, a few years ago this idea would have been ludicrous, because who has the time or skill to code plugins for everything. Sure, maybe it will have some kind of "asset store" where you can download and install plugins others have made. But the main idea is to use AI for writing the plugin code: if you roughly know what you want, you can feed an AI agent the provided API&UI template and an idea of some effect or tool, and it will just do it for you. A simple one-shot example of a prompt I used was "Can you make a plugin that smears the image context. Here's an example you can use as a template: [template code]". Then, I just copy paste the generated code to Hypergoblet, and I can immediately use the tool, and control the smear amount using the generated UI. It's "AI powered" in the right way, I think. And, if you know how to code yourself, you can do so without any AI involvement at all.
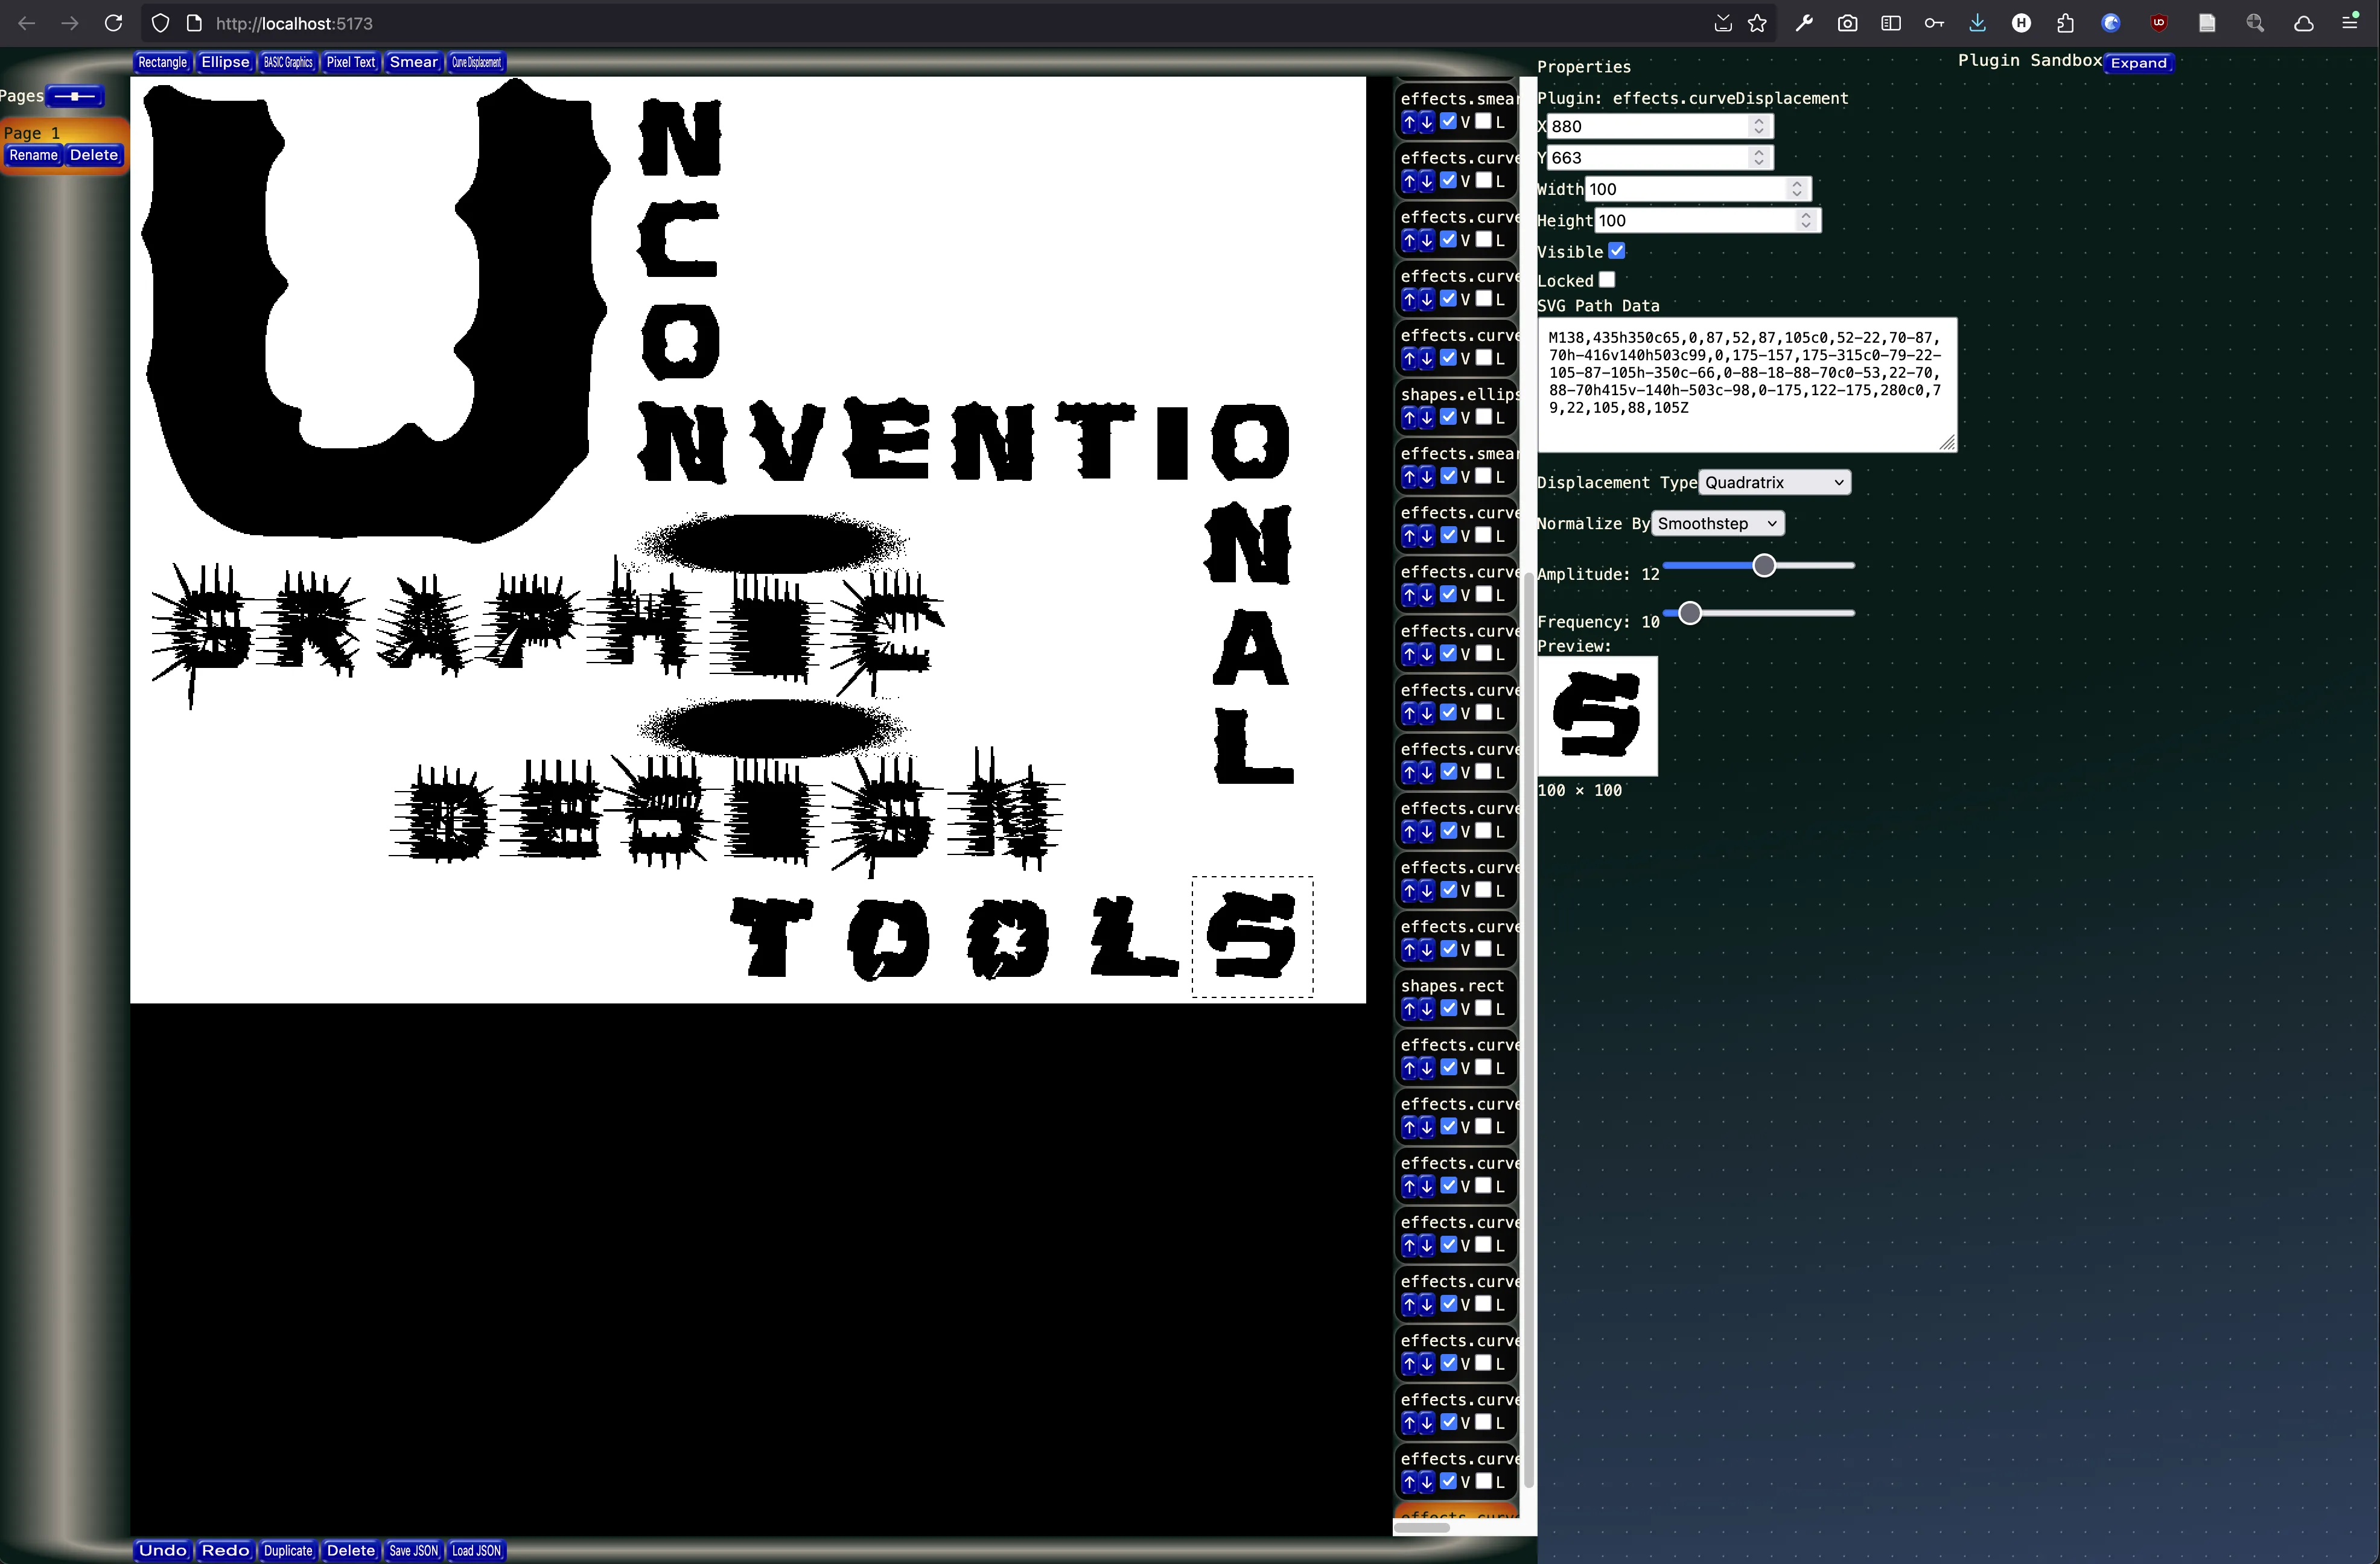
But even with AI, a more complex tool plugin requires a bit more thought and effort. Still, the fact that you can make stuff that is simply not available in any other software is pretty amazing. For example, the spiky and distorted "unconventional graphic design tools" type in the screenshot is made with an SVG curve displacement plugin I developed originally as a web component demo. It calculates the normal vector of points along the SVG path, then displaces them using mathematical functions, like "Witch of Agnesi" (1 / (1 + x²)) [1]. The curve is then normalized by another curve like a basic sine wave, so the starting and ending points match perfectly at y=0. Then, amplitude and frequency controls the scale and repeat of the effect. It's easier to show than explain, so you can play around with it below:
Another example. I found this 1986 book Geometric and Artistic Graphics — Design Generation with Microcomputers by Jean-Paul Delahaye from the Aalto library, which included many instructions for drawing graphics with MS BASIC. Made a simple MS BASIC interpreter for javascript, which uses the commands to draw onto a HTML canvas. Then, turned that into a plugin for Hypergoblet. Here's a standalone demo which you can try. Press "RUN" to render the graphic and check the few exampels I typed in from the book. (Open in new page)
The future of Hypergoblet is still unknown. It shows a lot of promise, but I'm still a bit unsure on some directions I want to take because it's a fairly complex project. I might get back to this in the spring.
That's all for now. If you want to contact me, send me an email at hlotvonen@gmail.com